Tuesday, 8 November 2016

CAD/JPY Is Testing the Resistance at 78.20


CAD/JPY formed a large bullish gap when the market opened yesterday and so far the pair has not recovered that gap yet. It has, however, formed a hanging man candlestick on the daily time-frame below the resistance at 78.20. Despite that hanging man candlestick the pair is still testing the resistance level and a possible breakout above it will likely lead to a further move to the upside towards the next resistance at 78.85, which coincides with the (MA)89 indicator on the same time-frame. On the other hand, if the hanging man candlestick turns out to be a valid signal for an impending move to the downside then we will likely see the pair recover the aforementioned gap.

All that said, keep in mind that the elections in the USA today will cause major volatility on the market that could affect even non-USD pairs.

Monday, 7 November 2016

EUR/GBP Is Testing the Support at 0.8855


Because of the presidential elections in the USA and the impending volatility they will cause, today I decided to turn my attention to a pair that is not related to the US dollar, namely the EUR/GBP. This pair has been slowly moving to the downside for nearly a month now, ever since it formed a doji candlestick on the weekly time-frame three weeks ago. That move to the downside might stall, however, as EUR/GBP is still testing the support at 0.8855 and, more importantly, it has formed a hammer candlestick above that level on the daily time-frame. If this candlestick is a valid signal then we can likely expect a move to the upside towards 0.8960 – 0.8970. On the other hand, if the pair breaks below the aforementioned support it will likely continue dropping towards the next major level of support which is at 0.8620 and coincides with the (MA)89 indicator on the daily time-frame.

Thursday, 3 November 2016

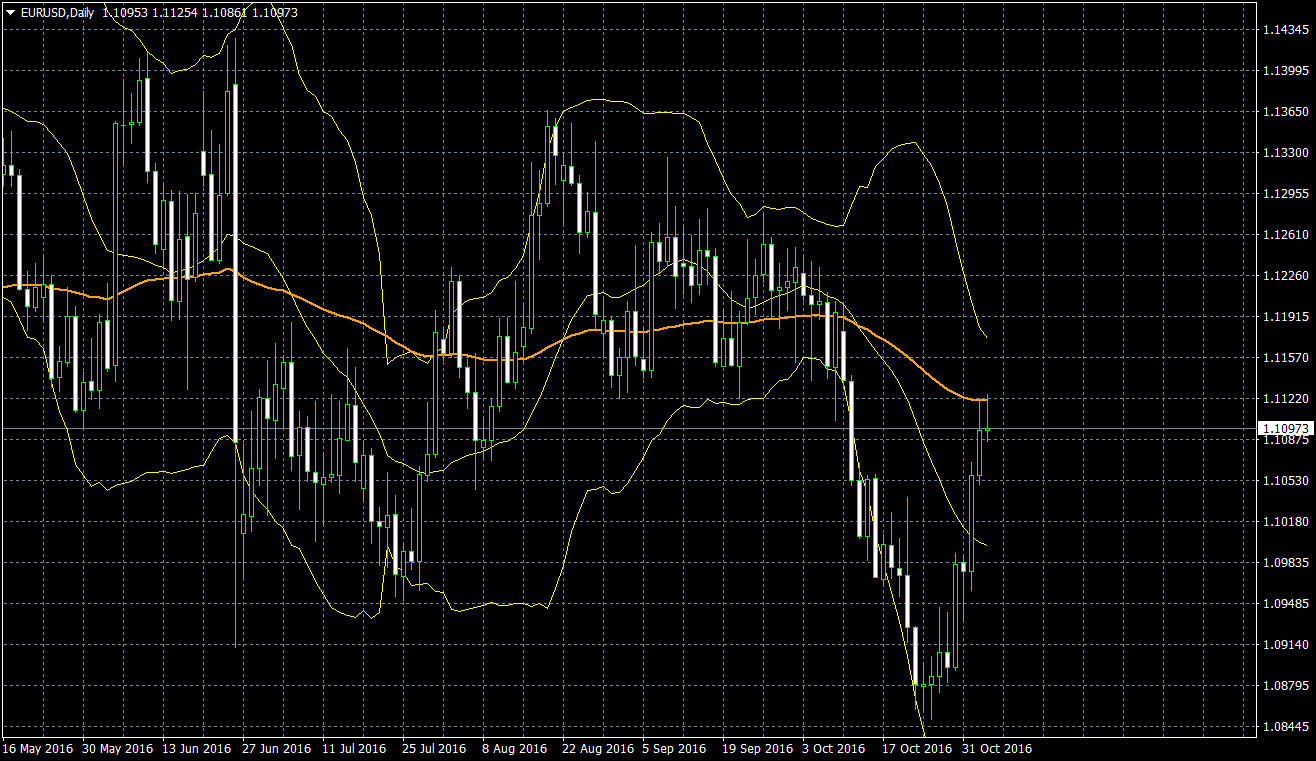
EUR/USD Bounced off 1.1125


EUR/USD reached its target at 1.1100 and then climbed above that to 1.1125, but the move to the upside might stall or reverse altogether for now because the pair bounced off the resistance at the same level, which coincides with the (MA)89 indicator on the daily time-frame. What is more, EUR/USD has formed a shooting star candlestick on the four-hour time-frame below that level. Considering these circumstances I think that there will likely be a move to the downside towards the first level of support at 1.1040, which coincides with the same indicator on the one-hour time-frame. A breakout below that level will probably lead to a further drop towards 1.1000.