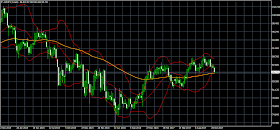
It took
almost two months, but the move to the downside that began when AUD/JPY formed
the high at 90.30 and formed a shooting star candlestick on the weekly
time-frame at that level finally reached the support at 85.50, which coincides
with the (MA)89 indicator on the same time-frame. Currently the pair is testing
that support and the question is whether it will be able to break out below it.
Considering how bearish it is such a breakout is likely and if it does occur
there will probably be a further move to the downside towards the next support,
which is at 81.80. Alternately, if the pair bounces off from the (MA)89
indicator on the weekly time-frame it could climb back to 87.60.

Let's see whether it will keep depreciating.
ReplyDeleteWill be watchfl around these levels, thanks!
ReplyDeleteIt could be a good inflection point.
ReplyDeleteDownside it is.
ReplyDelete