Friday, 29 September 2017

AUD/USD Is Bearish


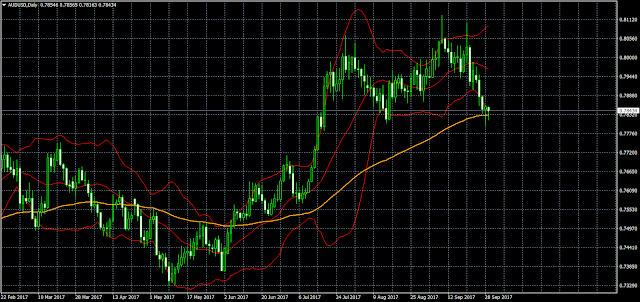
There were multiple signals on the various long-term AUD/USD time-frames that the move to the upside was over and that there would likely be a new move south – a shooting star candlestick on the monthly time-frame, a hanging man candlestick on the weekly time-frame, a pair of very impressive shooting star candlesticks on the daily time-frame. They all proved to be valid signals and the move to the downside did begin. 

Currently AUD/USD is testing the support at 0.7830, which coincides with the (MA)89 indicator on the daily time-frame. The pair has formed a hammer candlestick at that level on the same time-frame, so there might be a temporary retracement, likely towards 0.7900, but the various signals for a move south remain valid. Should there be a breakout below 0.7830 next target will probably be at 0.7670.
Thursday, 28 September 2017

Gold Is Testing $1,280


After Gold formed a shooting star candlestick on the daily time-frame and bounced off from the resistance at $1,357 the precious metal gradually moved to the downside and it finally reached its target the support at $1,280, which coincides with the (MA)89 indicator on the daily time-frame. Currently Gold is testing that support and considering how bearish it is it may break out below it after all. Should that happen, next target will probably be at the next major support level, which is at $1,250, which in turn is the same (MA)89 indicator, but on the weekly time-frame. On the other hand, should the precious metal bounce off from $1,280 it will probably retrace back to $1,300.

Wednesday, 27 September 2017

EUR/GBP Is Still Very Bearish


EUR/GBP is still quite bearish after it formed an impressive double top at the resistance at 0.9307 and bounced off from that level. The move to the downside continued until the pair reached some support 0.8780 and formed an inverted hammer candlestick at that level on the weekly time-frame. Despite that candlestick the pair is still very bearish and is attempting to break out below the aforementioned support at 0.8780. If the breakout is confirmed there will likely be a further move to the downside towards the next major support at 0.8480, which is the (MA)89 indicator on the weekly time-frame. Alternately, if EUR/GBP bounces off from 0.8780 it may climb back to 0.8900.