EUR/USD has
been steadily moving to the upside for quite a while now – since March this
year, but it appears that there will likely be at least a temporary retracement
before the pair continues rallying. The pair has formed a very clear shooting
star candlestick on the daily time-frame at 1.2070 and has already begun moving
to the downside. The closest target is likely around 1.1830, which is the
(MA)89 indicator on the four-hour time-frame. Should the pair break out below
that support level as well, it will likely continue falling towards 1.1660 or
even 1.1600. On the other hand, if or when the pair does break out above 1.2070
the rally will likely continue towards 1.2100 – 1.2200.
Wednesday, 30 August 2017
EUR/GBP Formed a Double Top
The
situation with EUR/GBP is quite similar to EUR/USD – the pair has been moving
steadily to the upside for a while and it has currently formed a shooting star
candlestick on the daily time-frame at 0.9305. What is more, however, is the
fact that the pair reached the previous high at 0.9304 before forming that
candlestick and clearly bounced off from it. So in addition to the shooting
star candlestick there is a rather impressive double top at the aforementioned
resistance at 0.9305 which is clearly visible on the weekly time-frame. The
pair will likely continue falling, and its closest target to the downside is
probably around 0.9130.
Tuesday, 29 August 2017
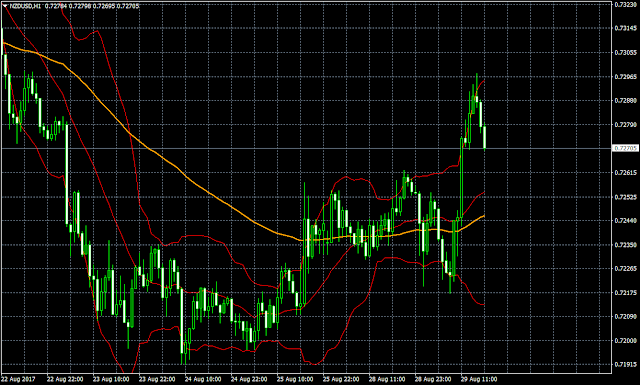
NZD/USD Bounced off from 0.7300
NZD/USD
bounced off from 0.7190 and started moving to the upside last week, rallying sharply for
the past few hours and briefly broke out above the resistance at 0.7280, which
coincides with the (MA)89 indicator on the four-hour time-frame, until it
finally found some resistance at 0.7300 and started retracing to the downside. The
retracement was unsurprising, considering the obvious shooting star candlestick
on the one-hour time-frame at 0.7300. The next target to the downside will likely
be around 0.7245, which coincides with the same (MA)89 indicator, but on the
one-hour time-frame. A breakout below that level could lead to a further drop
towards the last low at 0.7217.
Subscribe to:
Posts (Atom)


